
4 IT Metrics That Reveal Whether Your Support Model Is Actually Working
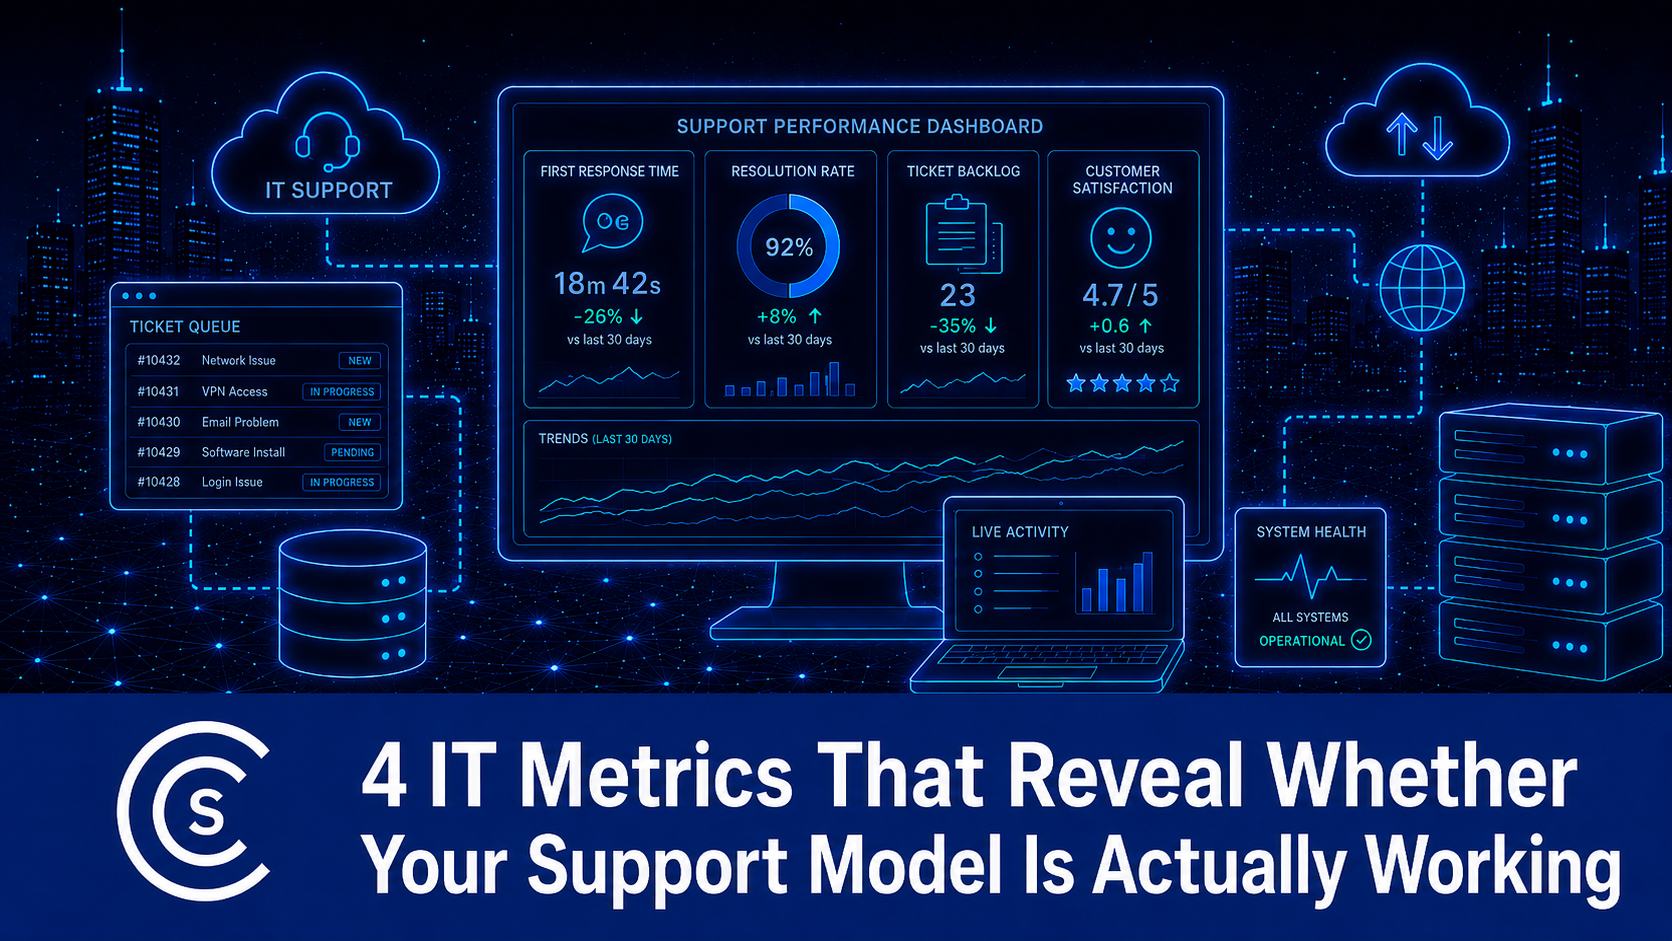
Good IT support should do more than just fix problems after employees have lost time. Businesses using managed IT services in Philadelphia need a support model that keeps work moving and reduces repeat trouble. CrafTech helps companies build a better way to manage daily technology needs.
A few simple measurements can show where support is working and where cracks are starting to form. Looking at the right data can also reveal wasted time, weak processes, and problems that keep coming back. Hiring CrafTech gives businesses an experienced IT team that can turn those findings into better support decisions.
Here are the IT metrics that can show whether your support model is truly doing its job.
Key Takeaways
- Fast ticket closures can hide repeat problems, long handoffs, and weak fixes.
- Support data can expose lost time, aging issues, and gaps that employees quietly work around.
- The right IT metrics show whether your support model prevents problems or simply reacts to them.
Ticket Handoff Count
Too many handoffs can turn a small IT problem into a long delay. Each new technician may need time to review the issue and learn what has already been tried. That can slow down fixes for network, cloud, server, and security problems.
Frequent transfers may also show that the support team lacks the right mix of skills. CrafTech can give businesses access to a wider range of technical knowledge in one place. Fewer handoffs can mean faster answers, less confusion, and less time lost for employees.
Seven-Day Repeat Rate
Quick ticket closures can look good, even as the same problem keeps coming back. A high repeat rate can show that the first fix did not solve the real cause. Reviewing this pattern can reveal whether managed IT services in Philadelphia are creating lasting results.
Hardware issues, bad settings, or old systems may be behind repeat complaints. Looking at what returns within a week helps separate short-term patches from real repairs. Fewer repeat tickets can mean less downtime and a smoother workday for employees.
Time Lost Between Detection and Action
Fast alerts do not help if nobody acts on them. A long delay between a warning and a response can allow small problems to grow in the background.
Alert Priority Rules Can Be Too Weak
Monitoring systems may flag dozens of events at the same time. Poor priority rules can bury serious warnings under low-risk notices. Better sorting helps urgent problems reach the right technician faster.
Ownership Gaps Slow the First Response
Some alerts sit untouched because no one knows who should take them. Clear ownership gives each warning a direct path to the person responsible for fixing it. This matters when network issues start affecting several users at once.
After-Hours Coverage Can Expose a Weak Spot
Technology problems do not follow normal office hours. Alerts that appear at night may sit too long when support coverage is limited. Tracking these delays can show whether the current support model leaves risky gaps outside the workday.
Change Failure Rate
Bad IT changes can create more trouble than they solve. Software updates, firewall edits, and server moves can lead to outages or slow systems when planning falls short. Measuring how often that happens can show whether the change process needs work.
Frequent rollbacks or new support tickets are warning signs worth watching. Careful testing and better planning can lower the risk before changes go live. CrafTech can add extra technical support when internal teams already have too much on their plate.
Avoid Costly Downtime By Investing in Our Managed IT Services in Philadelphia
IT support should earn its place by reducing downtime, repeat problems, and wasted employee time. CrafTech helps businesses turn support data into better decisions instead of relying on guesswork. The right metrics can reveal when it is time to improve the systems, processes, and IT support behind the business.
Frequently Asked Questions
What IT metrics should a business track to measure support performance?
Useful metrics include ticket handoffs, aging tickets, change failures, endpoint drift, and support demand per employee. Together, they show whether IT support is fixing problems at the source or simply keeping up with the queue.
How can employee workarounds reveal hidden IT support problems?
Employees often restart devices, switch systems, or create manual fixes instead of reporting every issue. Tracking those habits can expose technology problems that never appear in normal support reports.
When should a business rethink its IT support model?
A support model may need attention when problems keep returning, tickets sit open too long, or employees lose too much time dealing with technology. Those patterns can signal that the business needs better processes, more technical coverage, or help from an experienced team like CrafTech.